Dashboards
In this page we see steps to setup dashboards for monitoring the clusters
Accessing Grafana Credentials:
First step is getting access to grafana servers at http://<server-ip>:30002.
The username is admin. While the command below retrieves the admin password, which is stored as a Kubernetes secret in the default namespace:
kubectl get secret --namespace default grafana -o jsonpath="{.data.admin-password}" | base64 --decode ; echo
Adding Prometheus as a Data Source:
Before to setup the dashboard, prometheus must be defined as a datasource for grafana
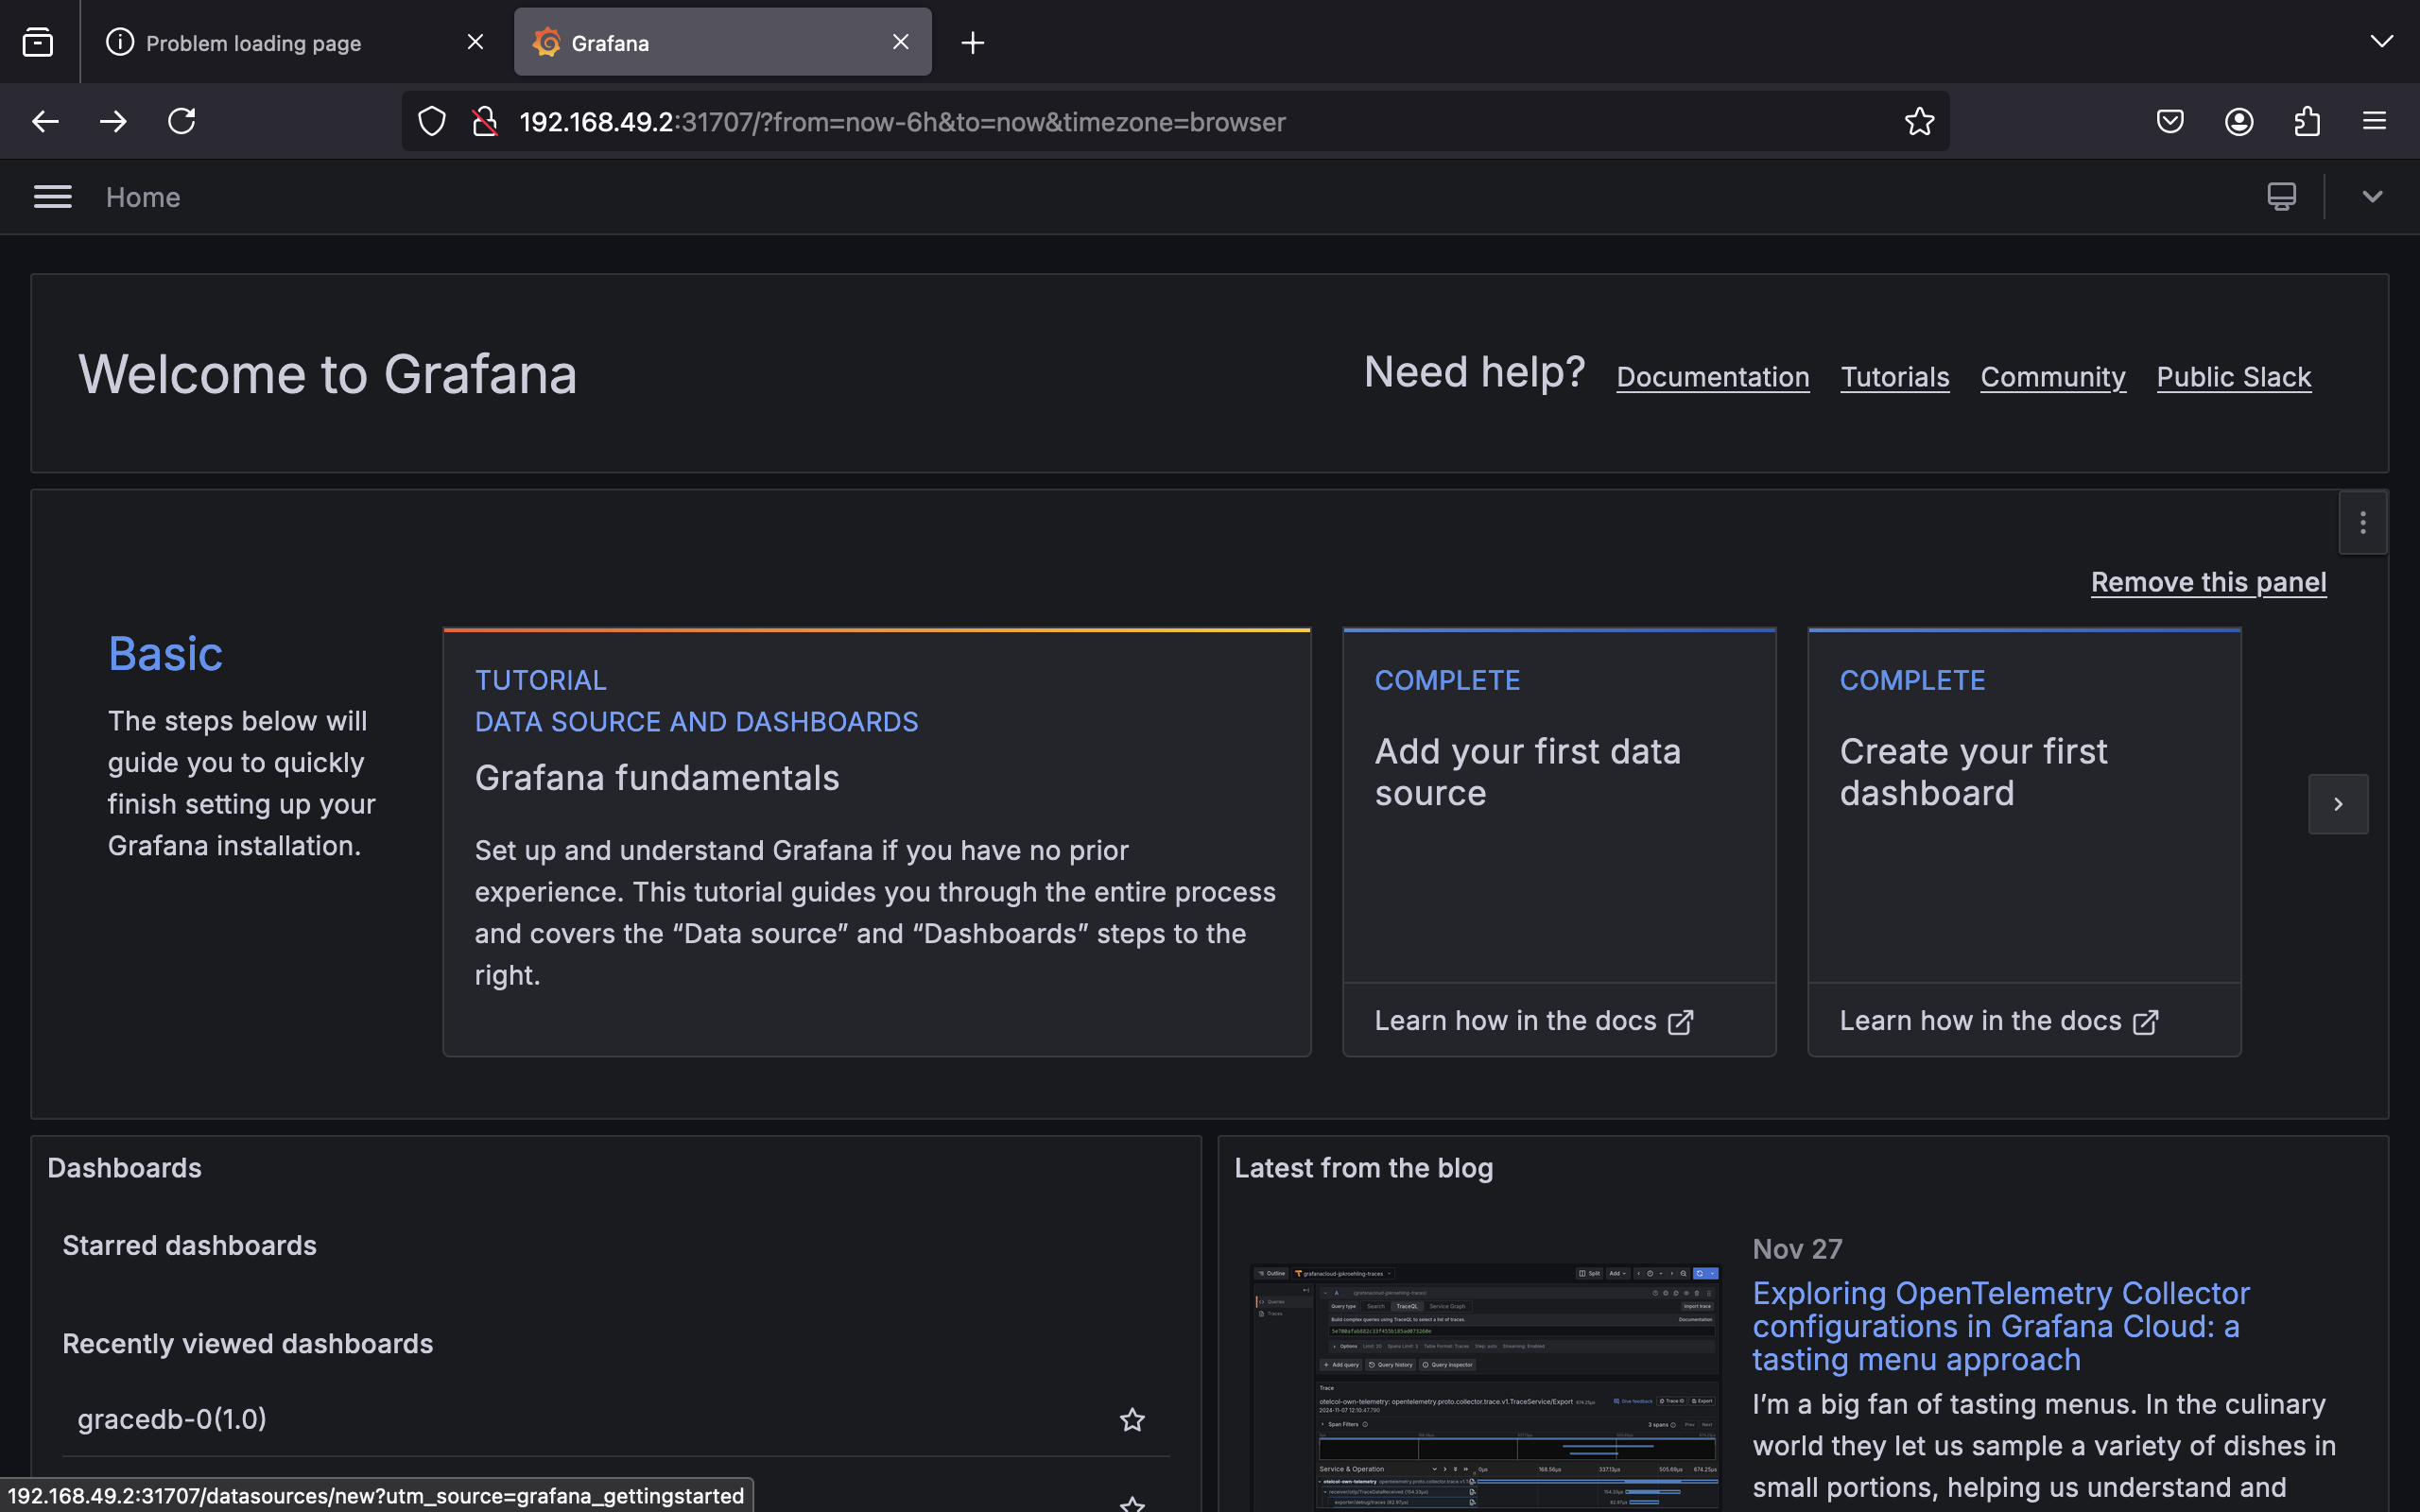
- Access Grafana with web browser.
- On the Grafana home page, click "Add your first data source".
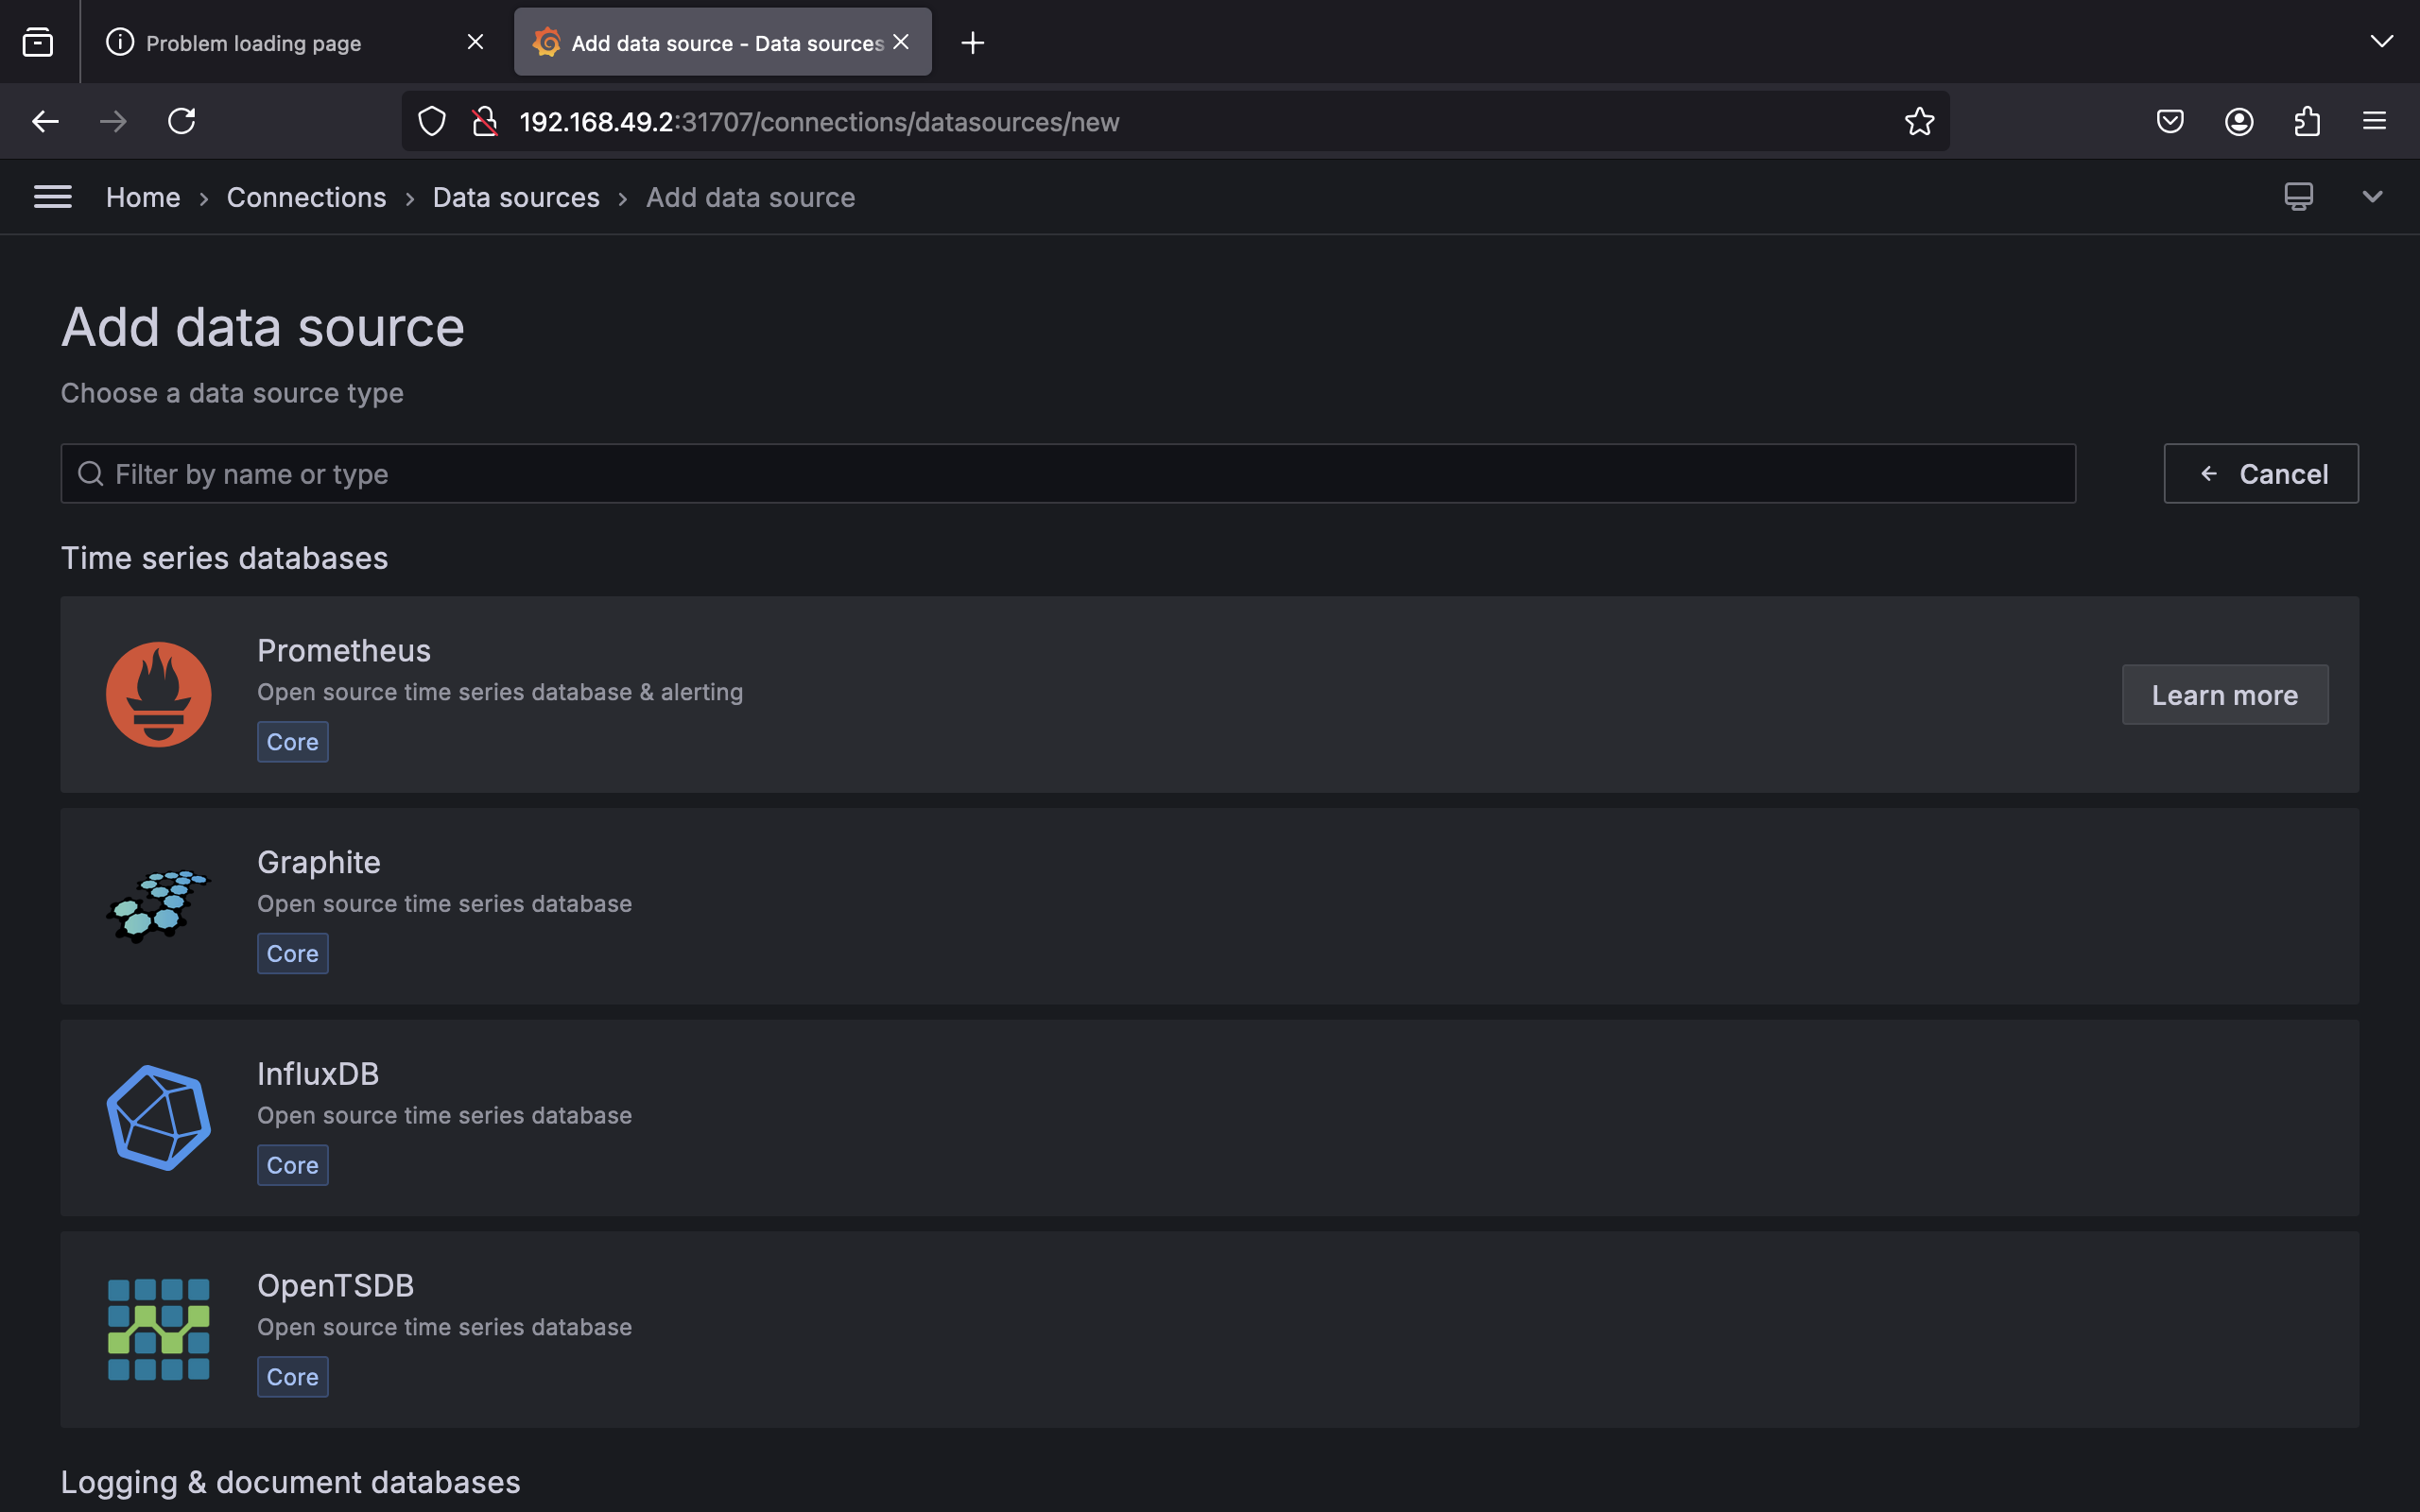
- From the list of available data sources, select Prometheus (under the "Time Series Databases" category).
- In the HTTP URL field, enter the URL to Prometheus server
http://<CLUSTER-IP>.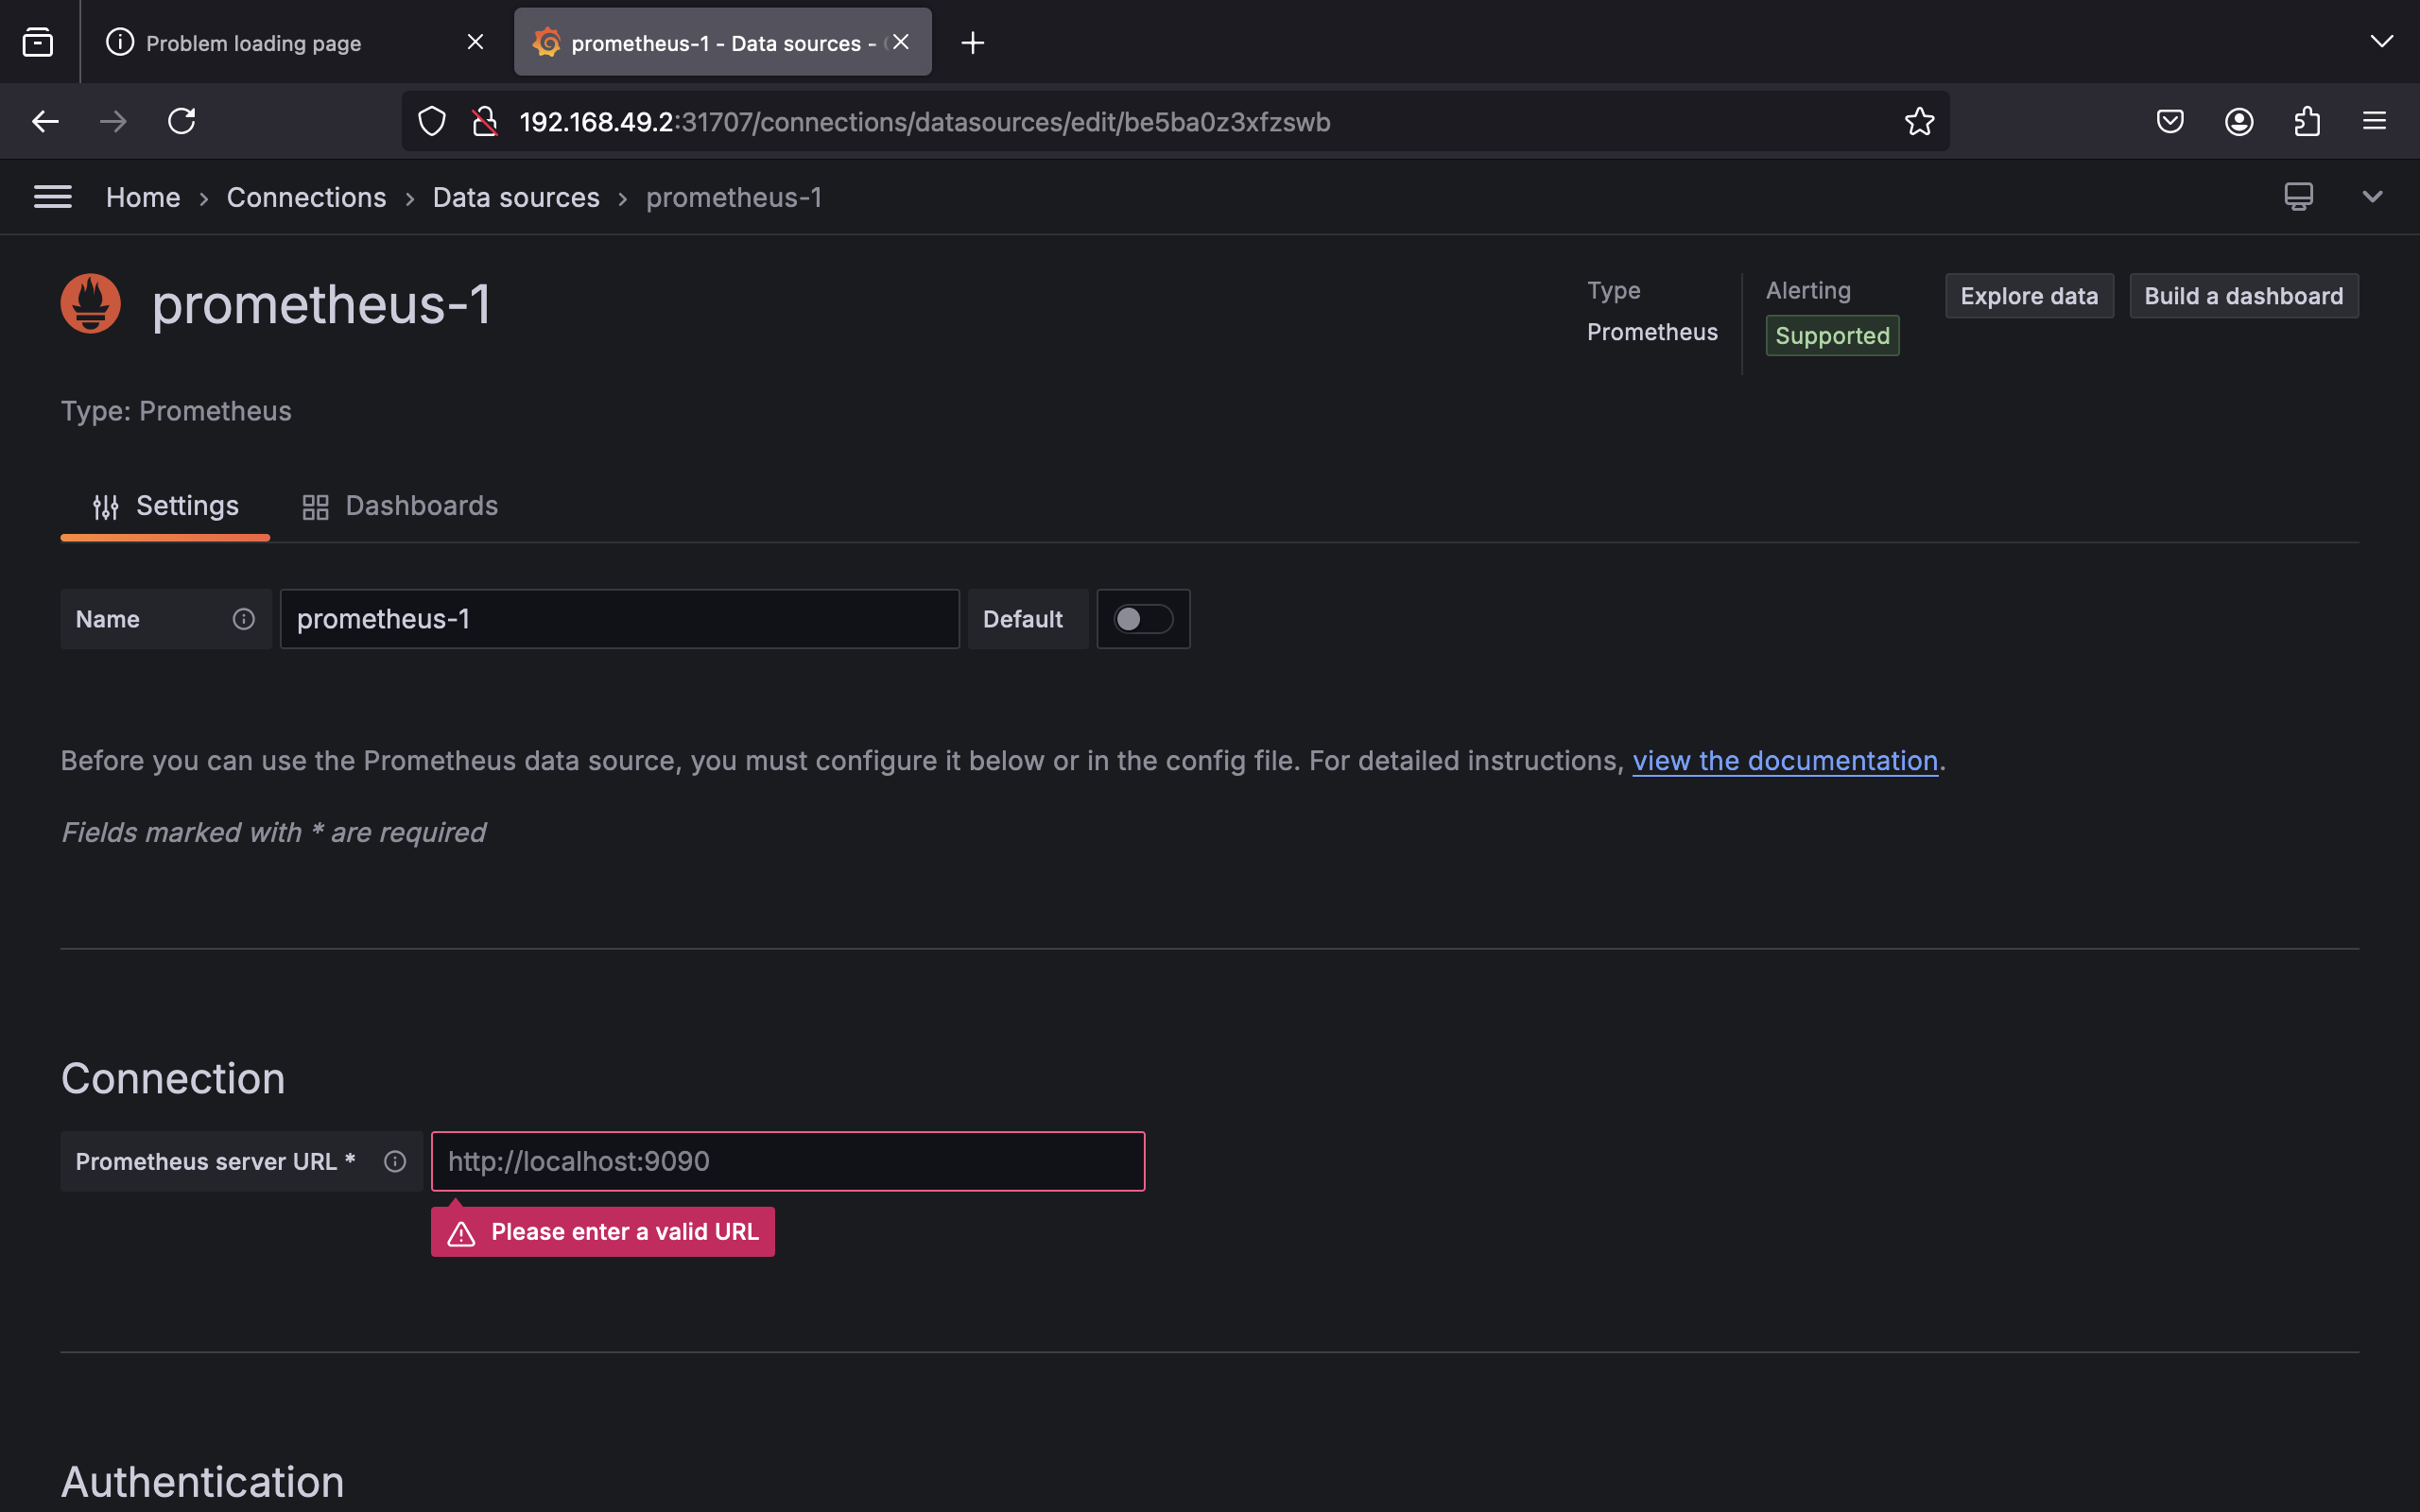
- Leave other settings as default unless you need specific configurations (e.g., authentication).
- Scroll to the bottom of the page and click the "Save & Test" button. Grafana will confirm if the connection to Prometheus is successful.
- Start Building Dashboards
Once the data source is added, you can use it to create panels and dashboards in Grafana.
Import a dashboard in Grafana:
- Navigate: ☰ → Dashboards → New → Import
- Upload: Select and upload the desired
.jsonfile.
json files with possible dashboards are available in ./grafana-dashboards .